
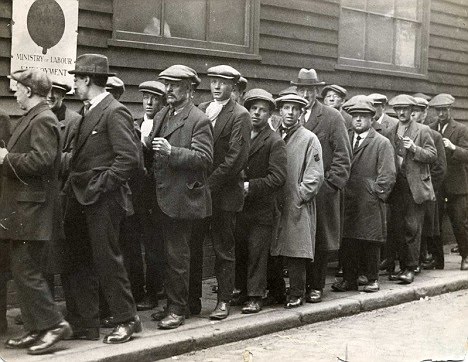
The Office of National Statistics (ONS) published its latest employment figures this week. As usual, the government latched onto any remotely positive figure that it could spin as proof of its ‘economic competence’ and the rightness of its policies. As usual under this government, the good news wasn’t really very good, and the reality was far darker and far bleaker – enough so politically, but far, far more for the ordinary people affected.
The government claimed that unemployment fell by 5,000 on the previous month, and most of the media dutifully echoed the ‘good news’. But the figures don’t stand up.
For most of last year, I published an analysis of the latest employment figures every month. The sheer volume of other things to write about, and the need to preserve some tiny semblance of an ordinary life, meant that I let that lapse a few months ago. But the difference between the claims and the reality is so stark this month, that I’m taking up the pen (or keyboard) again on the subject, to try to get the truth out there.
Here’s what I found from my examination of the various ONS data tables. As usual, I’ll be looking at the figures which are not ‘seasonally adjusted’ – statistics can appear to say all kinds of things, but the raw numbers are the nearest we have to what is actually happening ‘on the ground’, in the real lives of real people:
Employment: a huge fall
While the government claimed a drop of 5,000 in the unemployment figures, what really fell was employment.
In this month’s data, some 84,000 fewer people had jobs compared to the previous month – a massive fall in a single month. The number of people in employment was the lowest it has been since July last year.
That there was no corresponding increase in the official unemployment figures says much, much more about the government’s determination to prevent people from claiming their due benefits than it does about the true unemployment figure. The truth of this is reflected in our next category: economic inactivity.
Economic inactivity
To be ‘economically inactive’ means that you have no impact on the economy of the country at all. You do not earn anything. You do not receive any benefits. You do not have any money of your own to spend. Economically speaking, you might as well not exist. You’re not officially unemployed, since you don’t receive any benefits.
If you’re very, very lucky, you’re economically inactive by choice – you have someone providing for you whose income is enough that you don’t have to work. But for very many people, this is not a choice – it’s a sentence.
The number of people economically inactive in the most recent employment statistics rose by an incredible 182,000 – in a single month – and was the highest on record in the ONS data tables.
And here’s the kicker: the number of people economically inactive by choice is the lowest it has been in 10 years.
This means there has been a huge surge in the number of people who want to work but don’t have work and cannot get benefits. The disallowed. The disenfranchised. And there are more such people than at any time since the ONS recorded the data.
Not a pensioner? Then it’s worse still
The fall in unemployment mentioned above is for ‘all over 16’ – no upper limit on age. But the fall in employment among people below retirement age is far higher than 84,000: 230,000.
This figure means at least two things: first, a huge increase in the number of pensioners who are having to work to make ends meet; second, that the influx of pensioners coming out of retirement is preventing working age people from working.
And even if they weren’t, there would still be 84,000 fewer people in employment than in last month’s figures.
Even the South-East?
One of the common factors in previous employment figures has been a buoyant south-east. Even when unemployment was climbing in almost every other area, the south-east of the country resisted the phenomenon.
But in this month’s figures, even in the south-east the number in employment fell by 34,000. Unemployment only rose by 3,000 but don’t be fooled. That just means another 31,000 people who don’t have jobs, but can’t get benefits under this government’s draconian regime – in the most expensive area of the country.
Employment also fell in almost every other area of England – but rose in Scotland and Wales. In the two areas less subject to the direct control of this ‘government’, more people got into work.
The disabled hammered yet again
This government has consistently demonised the disabled, against all the evidence, to justify ruthless policies designed to impoverish and humiliate hundreds of thousands of people. Yet, although deprived of benefits and demonised as scroungers, disabled people still bear the brunt of the government’s economic malignancy.
Employment among disabled people fell by 65,000 – all while the government postures and claims that it’s only throwing them into penury to prevent them being ‘trapped’ in unemployment.
‘Claims’ adjusters
For employment to fall sharply while the unemployment figure notionally falls fractionally can only mean one thing: people cut adrift to cope or fail, or to depend on the kindness of others, because they’re prevented from claiming help from the state.
The number of unemployment benefit claimants is the lowest it has been in 18 months. But this is not, as the government would claim, because it’s getting people off benefits and into work. It’s just getting them off benefits – or the number of people in employment is going down.
This ‘sharp accounting practice’ by the government translates into a sociopathic disregard for the welfare of vulnerable people on the part of those in power. There is no other way to put it that fits the facts.
Employed, self-employed. Same difference
The number of people employed by companies, full-time or part-time, is the lowest it has been in 6 months. Normally, the government masks such bad news by trumpeting the number of people in self-employment as if it reflects some great return to entrepreneurship – even though the reality is that many people in self-employment have no likelihood of successfully earning a living.
But the latest figures show that self-employment has fallen too – just as it has fallen throughout the previous 6 months. This means, tragically, that many people who have been trying to work for themselves have had to admit defeat.
But they haven’t gone into ‘normal’ jobs instead – the number of employed people has fallen too. And they’re not on benefits – the number of officially unemployed people is fractionally down. They’re just in limbo – economically inactive.
Redundant expression?
The situation is not just bad, but getting worse. The number of redundancies in the latest figures is up by a massive 7% on the previous month. Far from the supposed economic confidence that the government is trying to talk into existence, companies are now shedding the staff that they retained through a long, tough period in the hope of finding work for them. Chickens are coming home to roost – and it means misery for many more thousands of people.
Sorry, no vacancies
Even though we have well over 230,000 fewer people in employment, the number of vacancies only rose by a paltry 7,000. For all the government’s claims that the figures vindicate their insane austerity policies and decimation of public employment, the reality is that jobs are disappearing from our economy.
In spite of the fudging and stretching of figures so that the coalition could claim to have avoided the ‘dreaded triple-dip’ recession, the reality is that our economy is contracting – because a growing economy creates jobs, needs jobs.
There is still only one vacancy in this country for every 5 unemployed people – and that’s only taking the officially unemployed. Add to it the hundreds of thousands of people who are excluded from work, excluded from benefits and excluded from our economy, and the real situation is far worse.
If this government’s lips are moving, they’re lying. For their own good and definitely not for that of the vast majority of us. Don’t believe the spin, and spread the word so others see through the deception too.
Reblogged this on Vox Political and commented:
Read this and weep, if you’ve got any kind of regard for anybody other than yourself. Conservative and Liberal Democrat MPs are therefore excused.
no, they most definately aren’t excused .. they are condemned. Thanks for doing the spadework on this issue…political spin is a crime against the population
Reblogged this on nearlydead.
So why isn’t Ed Milliband shouting this from the roof tops? Says a lot about Labour, and for what passes as democracy in the UK. They’re all in it together. One nation, no chance.
… thank you for that well analysed info. Now we see why this government are so reticent about publishing those jobseekers’ ‘sanction’ statistics!
Absolutely.
Snap!
I suspect the figures are going to be significantly higher! Personal Improvement Plans were being issued to staff around October 2012 at the same time the sanction length increased!
Statistics show some offices increased their activity by 500% from November 2012. You would expect the level of sanctions to decrease when they become more severe!
However, to help reduce the JSA count the claimant is now off the register for much longer and many, no doubt try to claim ESA to avoid the sanction which means the claimant will be off JSA even longer. Unfortunately, the sanction kicks back in upon their return to JSA in many cases.
A revolving door situation has been created, The DWP claims a sanction and an off flow (positive) outcome, but the poor claimant has not been helped or supported into work. But the statistics look good!
Is this success? And, how much does it cost the tax payer?
The potential costs might include:
* Processing a new claim to another benefit
* Processing yet another claim to JSA if the claimant does not find work
* Administration of processing a sanction
* Tribunal costs
* Medical costs to the NHS for the treatment of stress/mental health issues
* Food banks providing much needed support in the interim
* Impact on children and the family – teachers report children missing school due to sanctions
* Court fees if claimant slips into debt
* Voluntary organisations helping the individual, e.g. CAB which is supported by government (the tax payer)
* Support from Social or Adult services
* Paramedic Services – there is a case cited on the FOI site where a diabetic man had lost his benefits and had not eaten for 3 days so the paramedics were called as he was at risk of falling into a coma
* Potential cost to the Samaritans when people become suicidal – another FOI story. A lady lost her benefits due not taking enough steps to look for work during a period when she had lost her dad and was supporting her mother. She claimed ESA but after 10 weeks no money received, she shouted out loud:
“The JCP caused my breakdown because they sanctioned me when my dad died. Someone out there has got to help us, we can’t go on like this, all I have to live off is my child benefit and the £168 per month my ex pays for our child. I AM BEGGING ON MY KNEES FOR SOME ORGANISATION TO HELP US BEFORE MANY DIE! I CAN’T COPE FOR MUCH LONGER!”
Further, most claimants now have to make themselves available for any work. In the past you could only be sanctioned if the job offered by the Jobcentre was for 24 hours or more.
If a claimant finds or is forced to accept part-time work and still needs to claim JSA/UC they are classified as employed. This reduces the unemployed count even further.
Jobcentre Plus objectives 2012-2013:
Our role as a Department is to support people into work, where they
are capable of working, and helping them to stay in work. We aim to
maintain our excellent track record of providing good quality advice
and support through the face to face services of Jobcentres, through our visiting service, and through our partnership with third parties.
1.3 We will continue to focus on moving people off benefits quickly and into sustainable work. Our Jobcentres will provide job-seeking and specialist advisor support to help people move into employment and training. We will work with our partners to provide services for the long term unemployed, for young people and for disabled people who need employment support tailored to their individual needs
Mmmm…………..
What brilliant info. Do you have a a link to the 500% stats?
@skywalker.
mylegal have been through some sanctions figures. Reply #8 here;
http://ilegal.org.uk/thread/7123/work-programme-working
Neil Wilson does some great graphs on this and private debt, financial balances at http://www.3 spoken. Co.uk
I actually wrote to the DWP about these figures a couple of months ago.
At the time George Osbourne was trumpeting “more employment than there has ever been” but still the unemployment figures were rising.
On investigating the DWP figures the exact same issue as this came to light.
Basically more “inactive” people are returning to the labour market. Partners or spouses who never used to, or needed to, work, early retired returning to work, University students filling part time posts,.
Bearing in mind there that there are around 8.7 million “economically inactive” between 16 and 64 years of age and you get a true picture of what is happening, any amount of these can, at any time, choose to return to the labour market. These are in addition to the 2.55 million “official unemployed”
Expect a huge decrease in the “seasonally adjusted ” level of unemployment amongst 16 to 24 year olds next year when the school leaving age rises take effect. Another way of massaging figures is to keep them in school if there are no jobs.
Brilliant stuff. Yes, I’ve made these points in earlier analyses – but no government minister would ever admit them!
Retweeted Steve!
🙂 Thank you!
Brilliantly illuminating piece. I’ll be sharing and recommending as much as possible. Thanks.
Reblogged this on HUMAN RIGHTS & POLITICAL JOURNAL and commented:
As Always In Solidarity!
Reblogged this on Grannie's Last Mix and commented:
This is way beyond shocking, I had no idea things were this bad. Thanks to Steve for his hard work making sure the truth gets out there, because none of our politicians seem to have the courage to tell us. Just done some research into homelessness and this is also a growing national scandal. As well as record numbers of families in unsuitable temporary accommodation we now have over 2,300 people living rough on the streets, with almost a quarter of these in London. Its hard enough trying to get a job when you have a roof over your head but this becomes nigh on impossible when you’re sleeping in doorways and maybe having to spend long hours begging for a few pence. Read more about this here and share:-
http://sparaszczukster.wordpress.com/2013/06/15/cameron-in-2008in-the-5th-richest-country-in-the-world-homelessness-is-a-disgrace-2013-why-is-he-increasing-homelessness-for-a-mere-2-saving-on-the-hb-bill/
Brilliant, thanks. Have reblogged this on The Word
http://www.cantpaywontpay.org/publish/?p=6904
Slightly off-topic but I took a look at the May “Fraud and Error in the Benefits System” tables yesterday and one thing struck me. Claimant fraud and error appears to have risen since 2005/6 by around 30-50% but “official error” has trebled and quadrupled.
I am no stats man but this might be something someone with half a brain (not me!) might take a look at. It suggests that the worst performing part of the benefits system is the benefits system.
Could you point me to that please? On the ONS site?
Thanks Steve well read and written, been on to your twiter and tweeted, reblogged and facebook keep up the great work you doing Steve 🙂
TYVM! 🙂
Sorry, no vacancies!
I suspect the few people who do not seem motivated to find work are often claiming benefits fraudulently or have ‘other’ income streams and are not really affected by sanctions, because the hardship payments together with housing benefits and reduced council tax are still worth having – they are cream on top of their illegal earnings. These type of people will often know the rules inside out or are particularly aggressive, so are more likely to be held at arms length.
The people most likely to receive sanctions are the honest, the vulnerable, the least assertive or organised (I do not mean this in a derogatory way) in this very tough and competitive labour market.
People naturally and without any prompting from JCP will apply for more jobs when the labour market is buoyant. However, when the market is depressed people will do less as there are fewer jobs to apply for. Those with the least skills and experience will quickly begin to feel despondent the more rejections they receive.
Employers cannot cope with the volumes of applications from Jobseekers who are compelled to apply for jobs they are not suitable for, because of their unreasonable Jobseeker Agreements. Many people are now forced to take 1000% more steps to look for work than they did prior to October 2012, However, they are required to do this with less money and when there are fewer jobs!
The pressure on Jobseekers is significant in these difficult times. Improving motivation, work and job search skills prepares people for employment and is helpful, but forcing people to apply relentlessly for unsuitable work or those that do not exist (speculative approaches) and then to sanction them in this climate to achieve off flow targets seems completely irrational, immoral and perverse.
There is also no evidence to suggest these methods are working! Some people may leave the register under pressure, but I suspect not many.
Here are all the jobs advertised in MB1 (Middlesbrough) on the UJM site on Friday 14/6 within a 10 mile radius.
https://jobsearch.direct.gov.uk/JobSearch/PowerSearch.aspx?jt=2&tm=1&where=TS1%2c%20Middlesbrough%2c%20North%20Yorkshire%2c%20England&rad=10&sort=rv.dt.di&pp=25&re=134&rad_units=miles&vw=b&setype=2
I rest my case!
Would you be interested to write a guest article on this for my blog?
You certainly inspire me and others to share and express our concerns about the harsh (some believe unlawful) government policies, which are hurting the people within our communities in a cruel and what appears to many to be in an unreasonable and unjust way. This is something I have never felt compelled to do before!
Not sure about my story writing skills! I will certainly give it some serious thought and will contact you very soon.
Reblogged this on paurina and commented:
what the stats really tell us (don’t rely on the government)
Hi Steve
You are possibly correct but it’s difficult to know without doing the research oneself. So can you include a few run charts showing the trends you highlight in the next update? They say a picture is worth a thousand words and a well constructed chart is certainly that in spades. Statistics can be made to say almost anything if quoted out of context or selectively. Displaying all the data in a chart makes that much harder to do and gives weight to your argument. As I say, I’m not disputing your version of events but without the context, you could be accused by those who have something to hide as doing the very thing you are writing against.
Regards
Mike Davidge
Director
Also Senior Improvement Advisor, 1000 Lives Plus programme: http://www.1000livesplus.wales.nhs.uk
[cid:image001.png@01CE6B82.E069BE70]
2 Orange Street, London WC2H 7DF
T: 020 3170 6315 M: 07786 510300
E: miked@nhselect.org.uk
http://www.nhselect.nhs.uk
WE ARE MOVING :
With effect from Monday 24th June 2013 our new location details will be:
Suite 1, Adam House,
7-10 Adam Street, London,
WC2N 6AA.
Telephone 020 7520 9088
Good point. I’m a fan of charts. However, in this instance if anyone doubts my conclusions the stats are on the ONS Labour data page for anyone to check, and to refute if they can.